Wednesday, December 7, 2022
MAIN TAKEAWAYS
The buildup in gasoline and diesel is bearish, while the decline in crude oil inventories, on its own, is not that bullish. However, gasoline and diesel inventories remain low by historical standards.
The end of oil releases from the US Strategic Petroleum Reserve (SPR) may not be bullish as some people have expected. You can find our explanation in this video about the role of the SPR in the oil market.
Attention should be focused on the crude oil that goes into refineries. A higher number indicates an increase in domestic demand for crude oil, and rise in the supply of oil products.
IN DETAIL
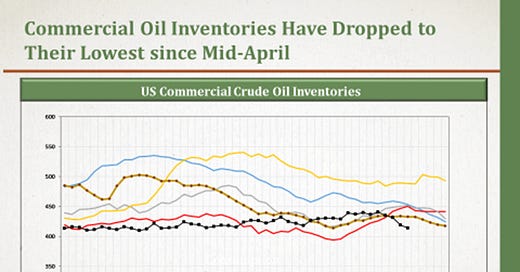
- The Energy Information Administration (EIA) reported a decrease in crude oil inventories by 5.2 mb to 413.9 mb, the lowest level since mid-April. It also reported a buildup in gasoline inventories by 5.3 mb and an increase in distillates inventories by 6.2 mb.
- The impact of the inventories’ data is mainly felt when the reported numbers significantly deviate from expectations. A “big surprise” is likely to cause a change in oil prices. The crude decline was higher than expected and products decline was way higher than expected. The result was a decrease in oil prices by 1.6%. (of course, there are always multiple factors that affect prices)
- The release of oil from the SPR is an “additional supply”, and the action is bearish. The impact of a decline in the SPR (withdrawal) is completely different from a drop in commercial inventories. The first is bearish, while the second is bullish.
Table (1)
Key Oil Inventory Data and Refinery Crude Inputs
Source: EIA, 2022 and EOA, 2022
Table (2)
US Crude Oil Imports and Exports and Petroleum Products Demand
Source: EIA, 2022 and EOA, 2022
IN CHARTS
1- Commercial Inventories: Despite the recent decline, which does not fit with historical trends, commercial crude inventories are not that low by historical standards.
Figure (1)
US Commercial Crude Inventories
The impact of this drop in crude oil inventories on the oil market can hardly be assessed by only looking at one chart. The current level needs to be compared to historical levels. By historical standards, stocks are standing at levels higher than the levels that existed prior to 2015 as shown in Figure (2).
Figure (2)
US Commercial Crude Inventory
The above two charts on their own could be misleading. For this reason, it is necessary to use days of cover: Inventories need to be normalized using another variable, and that is consumption. Even by that standard, inventories would still be within the historical range.
Figure (3)
US Commercial Crude Inventories Days of Cover
2- Gasoline Inventories: Despite the recent increase, gasoline inventories remain low by historical standers
Figure (4)
US Commercial Crude Inventories
3- Distillates Inventories: Despite improvement in recent weeks, they are still low by historical standards.
Figure (5)
US Distillates Fuel Oil Inventories
4- The SPR: The EIA reported a withdrawal of 2.1 mb. Although the SPR releases are coming to a halt, the US administration can resume SPR withdrawals in the future. It is also worth noting that the congressionally mandated sales from the SPR have not been released yet. You can find more on the SPR in this video.
Figure (6)
US Strategic Petroleum Reserves
Figure (7)
US Strategic Petroleum Reserve
5- Crude into Refineries: After serious delays, US refiners started increasing utilization and increased their crude oil demand.
Figure (8)
US Refining Capacity Vs. Crude Oil Inputs


